Traditionally TRANSP solved the ion energy balance equation with a neoclassically predicted thermal conductivity to determine the ion temperature profile. It is now possible to either read
in ion temperature profile data or to set the ion temperature to be some multiple of the electron temperature and use this to calculate the ion thermal conductivity in a similar way to how
it is calculated for the electrons.
If ion temperature profile data is provided this can be specified to be either the bulk ion temperature (default) or the impurity ion temperature. The other
temperature can then be calculated by solving the impurity and bulk ion power balance equations assuming a common local energy confinement time as described in
this paper by Steve Scott.
The following controls are used to select one of these behaviours:
NLTI2: Set this flag to TRUE in order to read in ion temperature profile data.
NLTI2TX: Set this flag to TRUE to indicate that the ion temperature profile data provided corresponds to the impurity species rather
than the bulk thermal ions. This is usually the case when the data comes from charge exchange measurements. The bulk ion temperature is then calculated as described in the
paper above.
Input ion temperature profile data is specified using the TI2 trigraph in the TRDAT namelist whereas scalar data is input using TIT.
NLTIPRO: If you wish to either directly use input ion temperature data or specify the ion temperature to be some multiple of the electron temperature
then this flag must be set to TRUE. If input profile data has been provided then TRANSP will calculate an anomalous multiplier profile for the thermal conductivity
which makes the neoclassical predictions match the measured values.
When NLTIPRO=.TRUE. the predictive model for the ion temperature is disabled and the ion temperature profile is either taken directly from data if the flag NLTI2=TRUE
or derived according to the following expression if NLTI2=FALSE:
Ti[used] = (1 - FIEFAC) × (GIEFAC × Te) + FIEFAC × Ti[data]
Where FIEFAC and GIEFAC are both real numbers between 0 and 1. Setting FIEFAC=1.0 and GIEFAC=0.0
would give the data value while setting FIEFAC=0.0 and GIEFAC=1.0 would give equal ion and electron temperatures.
When using Ti data the user can accommodate the fact that the input data may not cover the full radial extent of the plasma using the following controls:
TIXLIM : The maximum valid r/a of the Ti data.
TIFACX : The value of Ti/Te to use in the edge region where r/a > TIXLIM.
TIDXSW : The ion temperature profile will transition linearly from the value set by the input data to the value given by TIFACX*Te
over the range TIXLIM < r/a < TIXLIM + TIDXSW. The default value is 0.05.
TIXLIM0 : The minimum valid r/a of the Ti data. At this point the difference between the ion and electron temperature
Tdiff=Ti-Te is evaluated.
TIFACX0 : In the core, where r/a < TIXLIM0, Ti = Te + TIFACX0 × Tdiff.
TIDXSW0 : The ion temperature profile will transition linearly from the value set by the input data to the value given in the previous entry
over the range TIXLIM0 > r/a > TIXLIM - TIDXSW0.
It is possible to switch between using temperature data when it is available and predictively solving for the ion temperature using the NKIMODA switch described
in the Power Balance section. The user should be aware that this switch when set will overwrite the settings above.
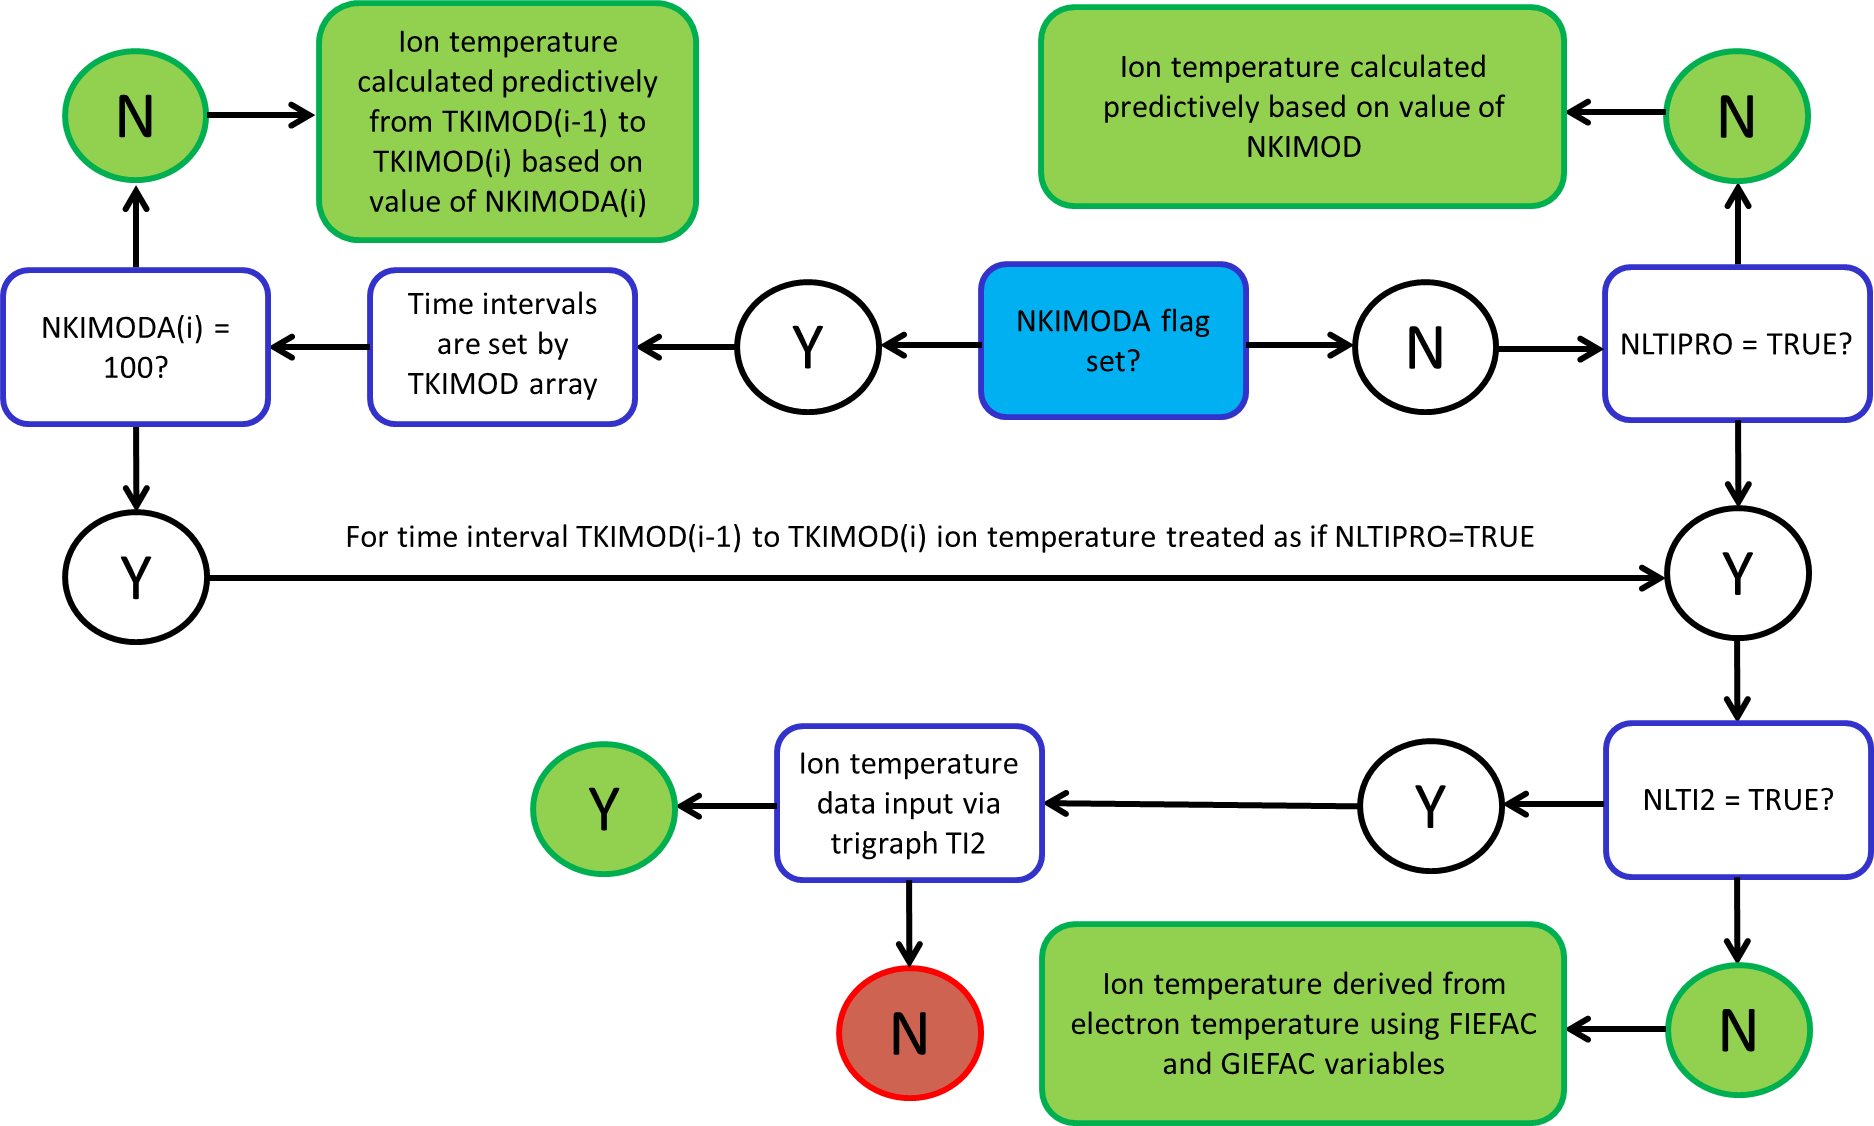
The following flow chart depicts the various options available for specifying the ion temperature. The starting location is the blue 'NKIMODA flag set?' decision box. If an end location is coloured green it represents a valid run configuration, if it is coloured red it is invalid and will not run successfully.