Getting started
Read and View data
Tutorials
How to Print
How to Export a file
PPF directory queries
Timeslice Data
 
Data sources
Standard Sets
Transp Data
MDSplus Data
How to Read ITER data
Regular Expressions (for JPF node list)
 
Modifying a plot
Modifying a plot
Zoom, Pan, Rotate
Selecting a signal
Moving a signal
Add/Remove signals
Layout
Title, Legend, Axes
Annotation
 
Styles
Styles
General style options
Single-valued signals
2D signals
3D signals
Colours
 
Processing Signals
Basic guide
Signal slicing
More Signal Processing
Saving PPF data
Simple Expressions
IBM NEWDSP-syntax
 
Signal Information
Signal Information
View Data as Text
 
Standard Sets
Standard Sets
Examples
IBM standard sets
 
Configuration
Preferences
Shortcuts
JETDSP's setup files
Style Editing - 3D signals

3D Signal Styles

When any signal is selected the style editor can invoked by clicking the 'Style...' button.

For a 3D signal (i.e., a signal which is a function of two independent variables - see types), the Style Editor dialog box looks like this:

Style3DEdit.bmp (139510 bytes)

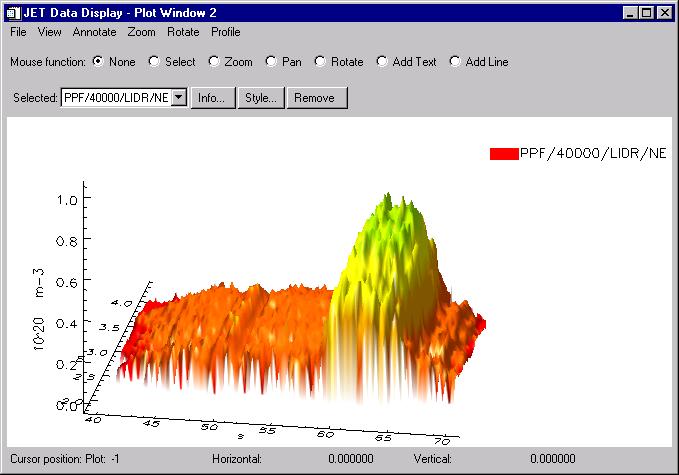
Change options as required and click Exit to apply the changes to the plot and close the dialog box.

These default settings will produce a line contour plot:

LIDRContour.bmp (161618 bytes)

Changing the 3D Plotting Style to Surface gives the following surface plot for the same data:

LIDRSurface.jpg (46902 bytes)

Note that:

  • contour and surface plots can be zoomed and panned like ordinary line plots - and rotated like surface plots

  • 3D rendering will be slow for platforms that do not support OpenGL in hardware (i.e., most UNIX implementations)


Top  JETDSP Home Page  Manual  FAQ 
Please send comments and questions to data-and-coding-support@ccfe.ac.uk.