 JETDSP for IDL Online Manual
JETDSP for IDL Online Manual
JETDSP for IDL Online Manual
|
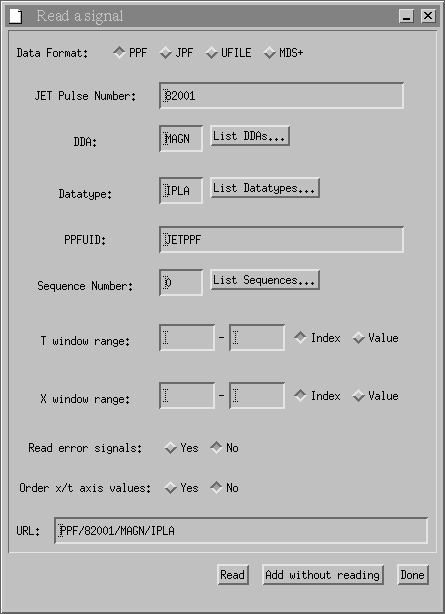
Getting Started with JETDSPTo run JETDSP on the Linux or Solaris clusters, type 'jetdsp' at the command line. On the Linux clusters, it is also listed on the launch menu, under "Applications" > "Fusion" > "JET Analysis Codes". JETDSP works primarily with JET data. To find out more about JET data in general, visit the JET data homepage. More information about PPFs in particular can be found in the PPF user guide. Information on how to read JPF data is also available. Reading and Plotting JET SignalsOn starting JETDSP, the following blank table will appear: To read a signal into the program, choose the Read Signal option from the File menu. This presents you with a dialog into which you can type the various components needed to define a signal: Click 'Read' after you have filled in the necessary fields. The program will warn you if the values you give do not define a signal that it can load. JETDSP may prompt you for a username and password. You will need to type in your JETNET username and password here. When the signal has been read, its name will appear in the table. The 'Read a signal' dialog is still visible, should you wish to define further signals. Click 'Done' to dismiss it. It is possible to read more than one signal at a time using the read dialog. The pulse can be specified as several values and/or a range. For example,
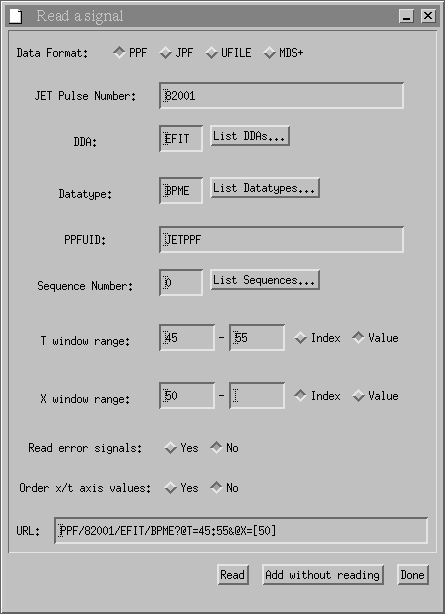
Note that the DDA/datatype listing is only for the first pulse in the dialog. In a similar way more than one DDA/datatype can be specified by separating them by commas. To retrieve only the part of a signal in a given x and/or t range, fill in the values you require in the corresponding range boxes.
The above example will retrieve all EFIT/BPME data between t=45 and t=55 on the 1D profile taken at the 50th x index. To plot all the signals, select 'Plot All Signals' from the 'Plot' menu. The signals will be plotted in a separate window. This is the View/Print window. The program can manage multiple copies of this window. Each time signals are plotted a new window is created. It is possible to plot only a subset of the signals. To do this mark the signals by clicking in the first column, (labelled 'M'), and then select 'Plot Marked Signals' from the 'Plot' menu. Note that a signal can be hidden by setting its plot number to 0 . To add a signal to the new window, choose 'Add Signal' from the window's 'File' menu. It will also be added to the main table, and may be used in new windows. |